
Start here: your first capture
Open the tracker, read the table, and learn the three things that surprise people: where it opens, what it cannot show, and what closing the window costs.
Updated
Loupewire is one window that records the HTTP traffic of every tab, so you can prove what the browser did to someone who was not there. DevTools gives you one Network panel per tab; a login that bounces through three hosts is three panels and no single list. This is that single list.
This page walks through a first capture end to end. It assumes nothing except that the extension is installed.
Open it
Press Ctrl+Shift+1, or click the Loupewire icon in the toolbar. Either way you get one tracker:
if it is already open, both routes focus the one you have rather than making a second.
It opens in its own window by default. That is not a style choice — Chrome discards background tabs when memory runs short, and a discarded tab would take the whole capture with it, silently. Nothing is written to disk, so there would be nothing to recover. You can switch to a tab in Settings if you prefer, with that trade-off now visible to you.
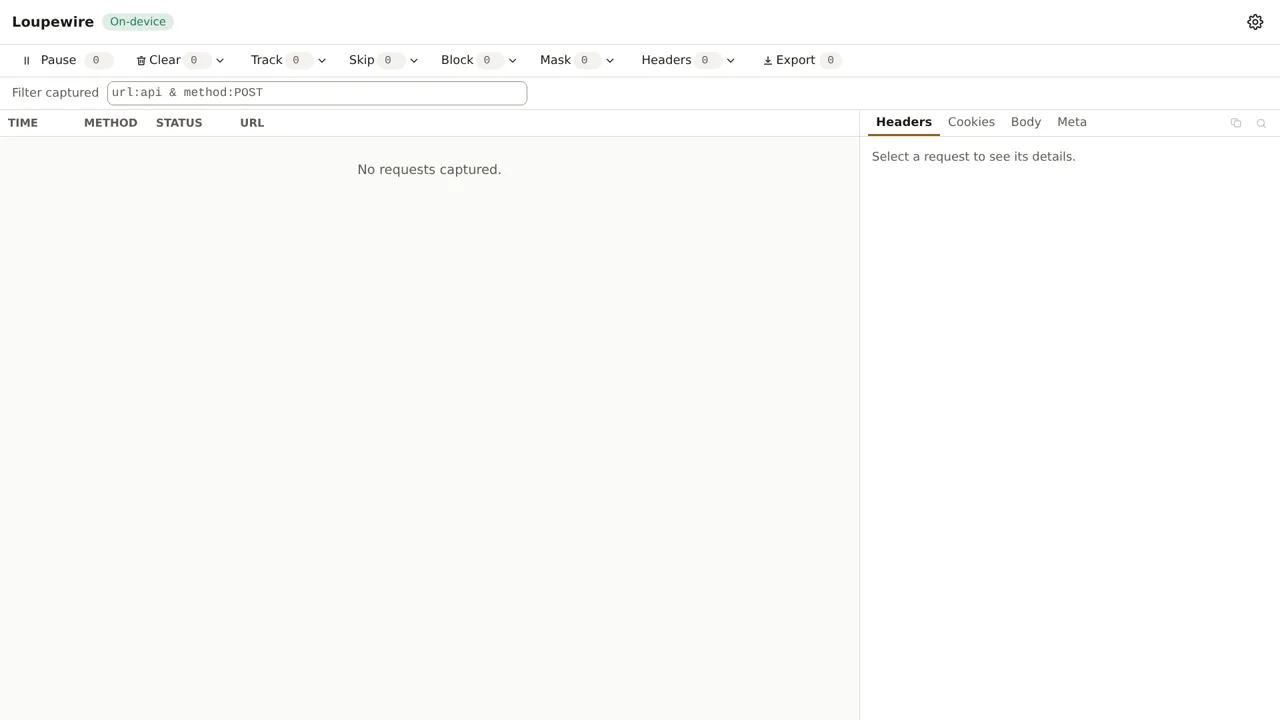
Changing that setting while a tracker is open moves it — the window becomes a tab, or the tab becomes a window — and everything already captured comes along. It is never closed and reopened.
Watch the table fill
Load a page. Every request from every tab in the browser appears here, including the ones you cannot see in a single Network panel: requests from other tabs, from popups, and every leg of a redirect chain as its own row.
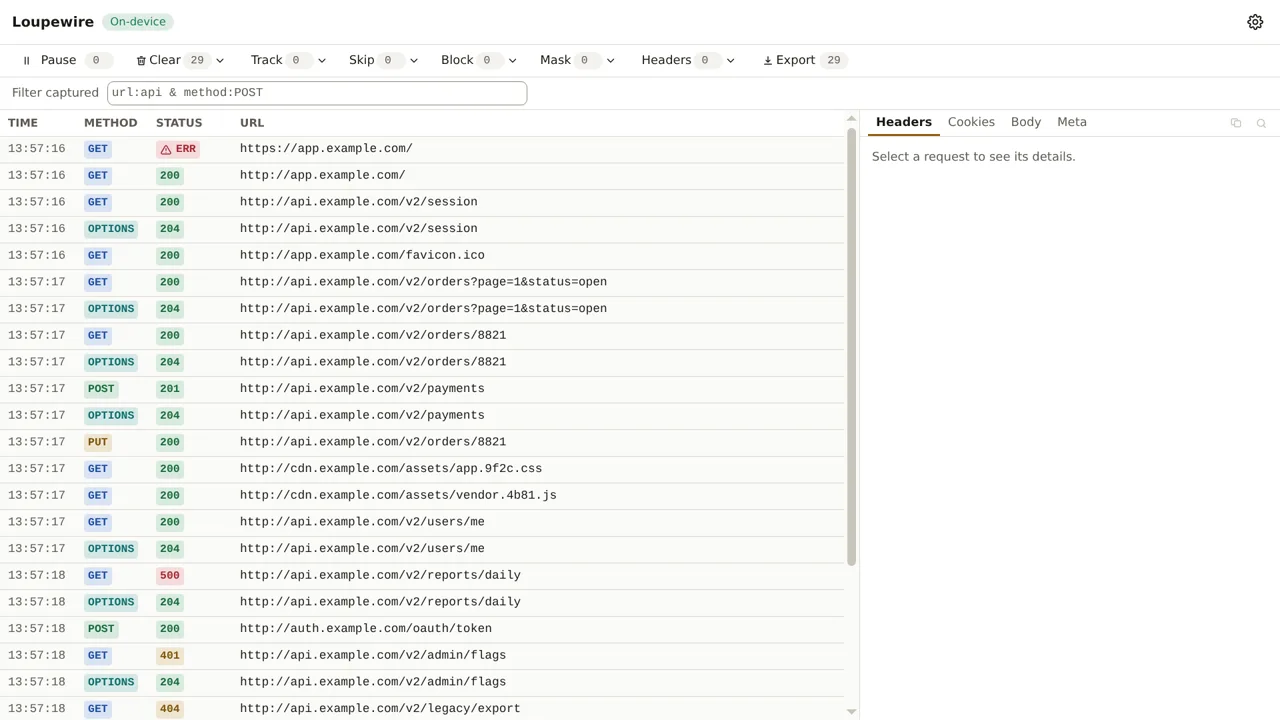
Four columns: TIME, METHOD, STATUS, URL. A request still in flight shows a waiting
mark rather than a status; one that failed shows ERR; one your own block pattern stopped shows
BLOCKED.
There are no response bodies here, and there never will be. The browser API this product is built on does not expose them, and the alternatives all cost more than they are worth — attaching a debugger puts a warning banner on every tab, and injecting a script into the page would break the promise that nothing is injected into websites. Request bodies, all headers and all cookies are here. Response bodies are not.
Read one request
Click a row. The panel on the right has four tabs:
- Headers — the request headers as they were actually sent, and the response headers as they arrived.
- Cookies — the cookies that went out with the request and the ones the response set.
- Body — the request body: form fields when the browser reported them, raw bytes otherwise.
- Meta — everything else the browser said: resource type, tab, initiator, server IP, duration, whether it came from cache.
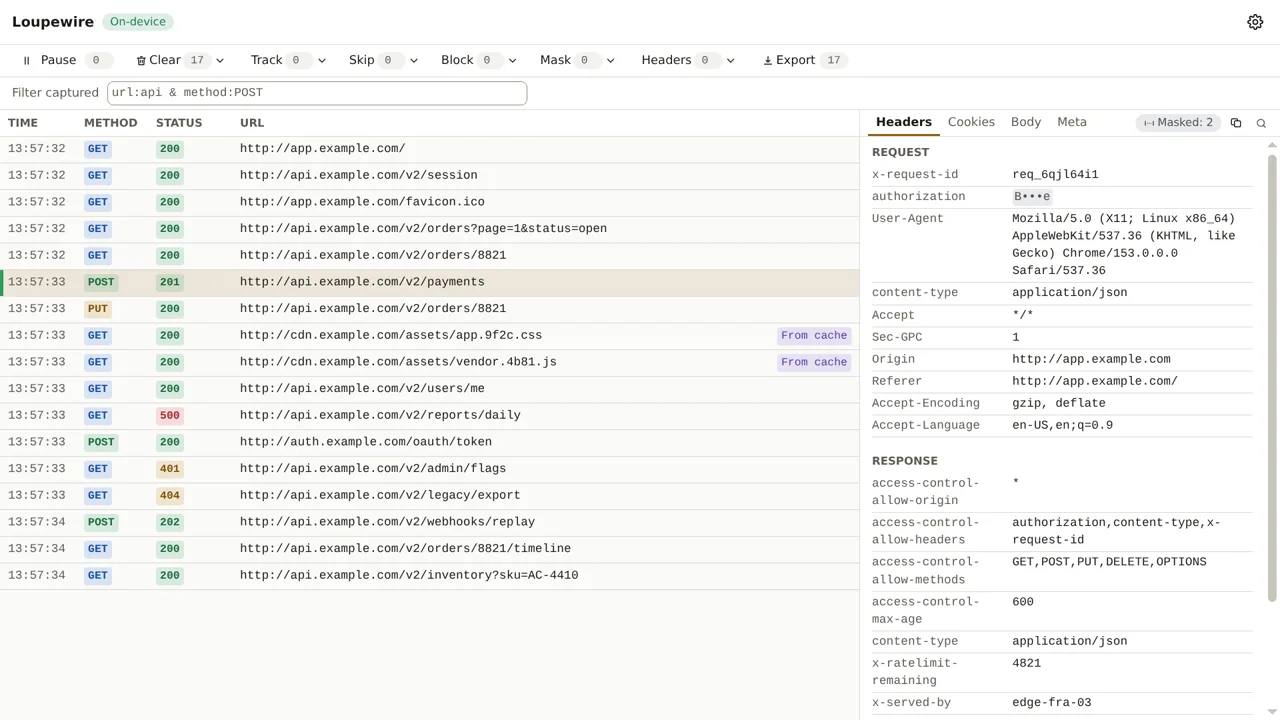
Some values are covered as B•••e the moment they appear. That is the built-in secret preset doing
its job before you have configured anything: Authorization, Cookie, tokens and the common
password and session field names are hidden on screen and in exports from the first request.
Pause, and clear
The first group in the toolbar is the capture controls.
Pause stops recording. It does not stop anything else: rows already captured stay, and — this is the part worth knowing — your block patterns and header rules stay in force. A paused tracker is still changing what your browser does. While paused, the button carries a count of the requests that would have become rows, so you know what you missed rather than guessing.
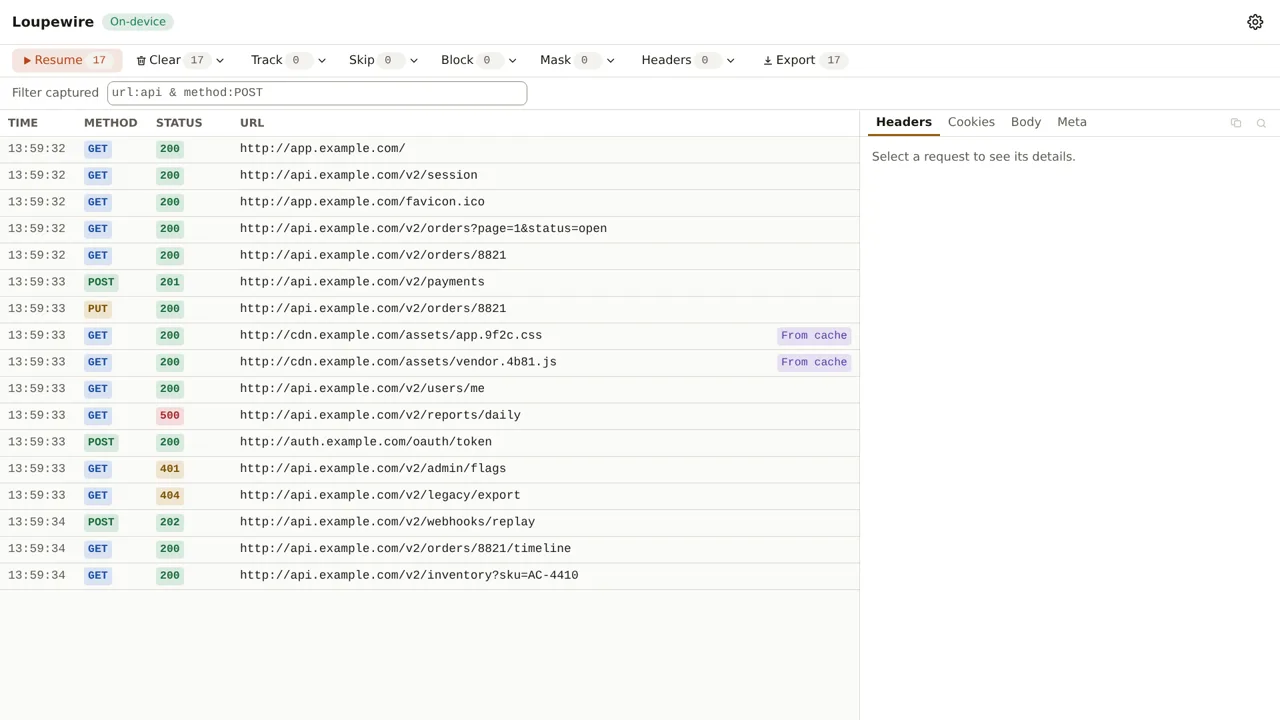
Clear has three entries: all, the selected rows, or the rows the filter is showing right now. "Shown" means exactly what is on screen — filter down to the noise and delete the noise. All and Shown always ask first, because nothing is saved anywhere and the dialog is the entire safety net.
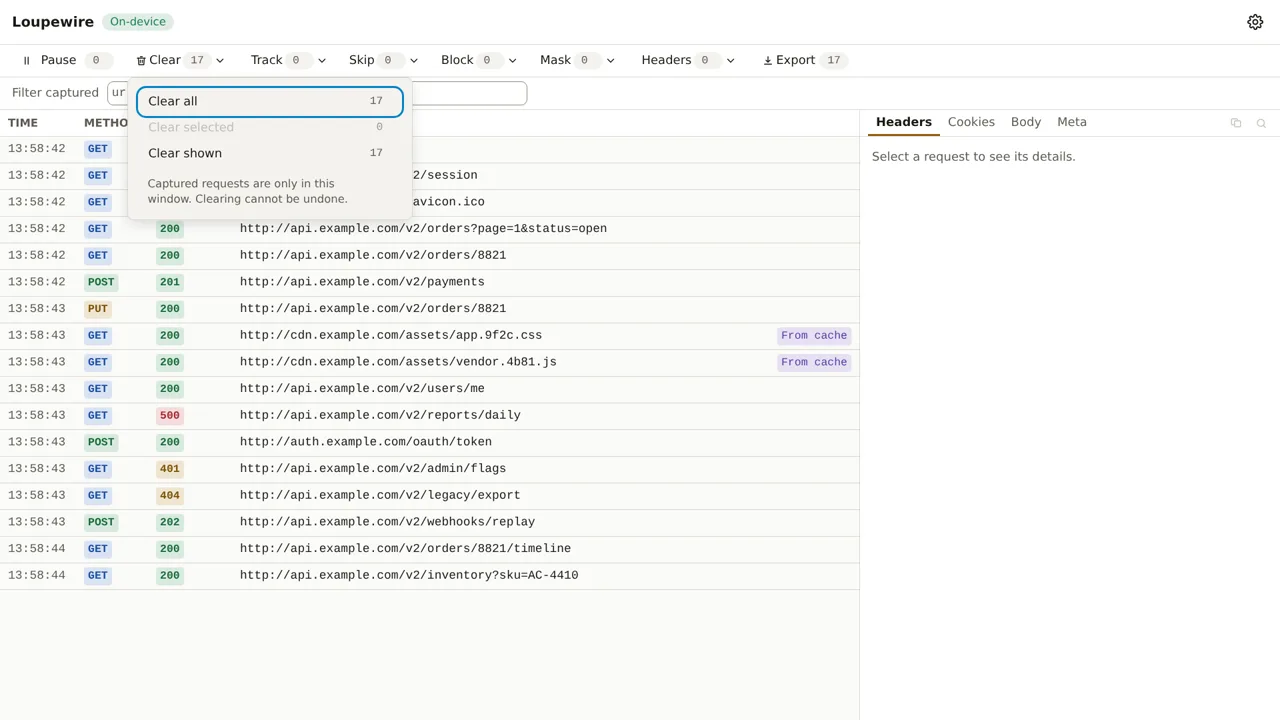
Two places for settings
Everything you type in the tracker's toolbar belongs to this window and is gone when it closes. Everything in Settings is stored and applies to every window from now on. The four pattern lists exist in both places and they are merged, not overridden.
That distinction, and the matching rules behind all of it, is the next thing to read: Patterns: one rule, four places.
Common mistakes
- Expecting the capture to survive the window. It does not. Nothing is written to disk — that is what makes the on-device promise cheap to keep — so closing the tracker loses every row. Export before you close.
- On Brave: a request that never appears. Brave Shields blocks inside the browser's own network
stack, below where any extension can see. A request Shields stopped produces no row, no
ERRand no explanation, which looks exactly like the tracker having missed it. If traffic you expect is simply absent on Brave, check Shields first. - Expecting to see another extension's traffic. You will not. A browser does not deliver one extension's requests to another extension's listeners. This is also the honest half of the privacy promise: this tracker could not look inside another extension's traffic even if it wanted to.
- Looking for the page's own
consoleoutput. This is a network tool. Logs, errors and JavaScript exceptions are DevTools' job.
Not in this version
Response bodies, saved sessions that survive the window, and comparing two requests side by side are all on the roadmap and not available today.